2022: Volume 3, Issue 1
Past Issues
 Abstract
  PDF
PDFInfluence of Fe3+ on Photophysical Properties of Alq3 Organic Nano Phosphors for Organic Light-Emitting Devices
S.A. Bhagat*
Kamla Nehru College, Sakkardara Square, Nagpur, India
*Corresponding author: S.A. Bhagat, Kamla Nehru College, Sakkardara Square, Nagpur, India. Tel: +919423064391, E-mail: [email protected]
Received Date: April 1, 2022 Published Date: May 2, 2022
ABSTRACT
Organic materials are held together by Vander Waals forces between molecules and are therefore ‘molecular solids. The consequence of this molecular nature is that the luminescence process in organic materials is associated with the excited states of molecules. Pure Fe3+ transition metal doped with Alq3 Complexes synthesized by simple precipitation method at room temperature, maintaining stochiometric ratio. These complexes were characterized by XRD, and photoluminescence (PL) spectra. XRD analysis exhibits the poly crystalline nature of the synthesized complexes. The excitation spectra are in the range of 509 nm to 498 nm, and emission spectra in the range of 423 to 427 nm. Prepared organic phosphor is found in the nano range. It can be a suitable candidate for indigo-violet emitting OLED, PLLCD and solid state lighting applications.
KEYWORDS: Transition metal, Nano organic Phosphor, Photoluminescence, FTIR, UV, OLED.
INTRODUCTION The last few decades have seen dramatic changes in research on luminescence. There has been phenomenal growth in the subject, and a significant progress has been made in the field of luminescence research. Recent research is characterized by strong interaction among other branches of solid state and between different areas of luminescence using inorganic and organic materials. An organic light emitting material is attracted attention owing to their applications in OLEDs [1] for industry and academic research. It stimulates interest in next-generation displays and lighting technologies [2]. The efficient and stable tri (8-hydroxyquinoline) aluminum (Alq3) is extensively studied for its high stability, good emission, easy synthesis, electron transport properties and high quantum efficiency. Alq3 is attributed as electron transporting layer, as emission layer where green light emission is generated by electron hole recombination in Alq3. It also acts as host material for various dyes to tune emission color from red to green [3]. Although Alq3 has low fluorescence efficiency, it has excellent properties as emitting material, namely high stablefilm forming, high carrier transport and good heat resistance. Tang and coworkers fabricated Alq3 based multi-layer thin film electro-luminescent devices in 1987 [4,5]. Alq3 still continues to be the workhorse among the class of low molecular weight materials for OLED. In recent years, solution-processed organic light emittingdiode devices (OLEDs) play important role as potential candidate for flat-panel displays and solid-state lighting due to their simple processing route and low manufacturing cost [6]. Research in novel organic materials for use in OLED has mostly focused on conjugated or low molecular weight materials and constitute a rapidly developing field for the future of flat panel display technology [7,8] role.These great progresses attracted extensive studies to OLEDs and contributed greatly to their rapid development. Owing to their thin-film, light-weight, fast-response, wide-viewingangle, high-contrast, full color and low-power attributes [10], OLEDs showed their unlimited potential to be mainstream of flat-panel-display technologies and they will be able to compete with the now-dominant liquid-crystal displays (LCDs) in the future display market. One of the advantages of OLEDs, compared with other display technologies, is the possibility of making flexible displays [11].Exploring these aspects, several complexes of metals such as Be, Zn and Cd with substituted 8-hydroxyquinoline ligands have been reported [12]. To some extent, the properties of organic materials have directly affected on the performance of OLED and these properties mainly depend on molecular structure. Iron is the most used of all the metals, including 95 % of all the metal tonnage produced worldwide. In 8- Hydroxy Quinoline metal complexes, the metal ions (such as Al, Zn, Sr, Ca, etc) stabilizes the molecular orbital of the “q” anions via interactions between the metal cation and the oxygen. Fe3+ transition metal has been selected for influence on Alq3. Hence it is proposed to synthesize and characterize iron doped Alq3, which is generally used as electron transport or emission layer iron doped Alq3. The main focus of OLED investigation has been to address this issue to conjugate organic polymer as aluminum tri hydroxyl quinoline (Alq3) [14-17].An attempt is made to increase the performance, lifetime and temperaturestability of the luminescent materials for OLEDs, solid state lightning, PLLCD.
EXPERIMENTAL Tris (8-hydroxyquinolinato) aluminum is the chemical compound with the formula Al (C9H6NO)3, widely abbreviated Alq3. as a shown in Fig. 1. It is a coordination complex wherein aluminum is bonded in a bidendate manner to the conjugate base of three 8-hydroxyquinoline ligands.
Synthesis of Alq3 and Fe3+ doped Alq3 5 gm. of HQ (8-hydroxy quinoline) was dissolved in 25 ml of distilled water and 25 ml acetic acid. The solution was heated to 500C for 30 min and filtered to remove insoluble impurities. For pure Alq3, 4.3069 gm of 3Al(NO3)3 9H2O was dissolved in 100 ml of distilled water. This solution was also heated to 50 0C for 30 min. Later the hydroxy-quinoline solution was slowly added to the above solution. Yellow precipitate was obtained. To this NH4OH4 was added to get the maximum yield. The yellow precipitate was then filtered and washed with warm water until the filtered water became colorless. Finally, it was dried at 600C for 2 hr in order to remove water molecules. Secondly, Iron (III) nitrate, or ferric nitrate, is with the formula Fe(NO3)3.(H2O)n. Most common is the nonhydrate is Fe(NO3)3.(H2O)9. The other derivative of Alq3 was synthesized by the same procedure, just by replacing Aluminum nitrate by of ferric nitrate mixed in an appropriate molar ratio.
In the synthesis process, when iron metal is added, it contributes an electron, withdrawing constituent at the 5-position in 8-hydroxyquinoline, thereby increasing the solubility of the corresponding metal quinolate complexes in non-polar solvents.
STRUCTURE

Table 1: Physical and chemical properties of Alq3 and Fe3+ doped Alq3

RESULTS AND DISCUSSION The synthesized complexes have been characterized by XRD on The ‘Expert pro’ Automated power Diffractometer system company name “Analytical”, Netherland taken at ‘SAIF’ Punjab University, Chandigarh. Photoluminescence (PL) emission spectra of the samples were recorded by using the RF-5301PC SHIMADZU Spectrofluorometer (RF-5301 PC).
X-ray Diffraction X-Ray Diffractogram of Fe3+ doped Alq3 exhibits well defined X-ray diffraction lines for the powder sample that confirm its crystalline nature. The presence of distinct lines confirmed the polycrystalline nature of the synthesized complex as shown in Fig. 2.
.png)
Fig. 2: X-ray diffractogram on Fe3+ doped Alq3
The value for first peak is found to be 80 nm, second peak is 88.12 nm, and other peaks are found to be in range of 66.76 nm, 86.80 nm, 80.49 nm, 96.84 nm, 80.90 nm, 69.19 nm. Average grain size of crystallites is found to be 80.90 nm. It exhibits that synthesized phosphor come under nano size compound.
Excitation and emission photoluminescence spectra of Alq3 and Fe3+ doped Alq3 Fig 3 exhibits the (i) excitation and (ii) emission spectra of Alq3 powder by excitation wavelength is 384 and 455 nm. The prominent PL emission peak is observed at 531 nm in greenregion of the spectrum well matched with the green emission of yellowish green powder earlier reported attributed to α-phase of meridianal isomer of Alq3 [18]. The PL excitation spectrum at 455nm of prepared Alq3 powder reveals that prepared phosphors is not only suitable for organic light emitting diode but also for photoluminescence liquid crystal display (PLLCD) and solid-state lighting applications.
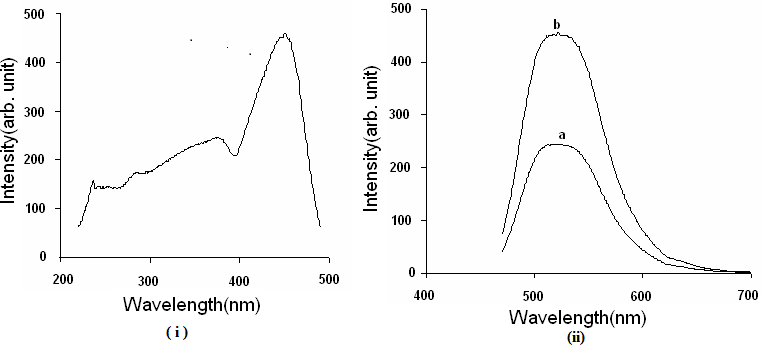
Fig 3: (i) Excitation and (ii) Emission spectra of Alq3
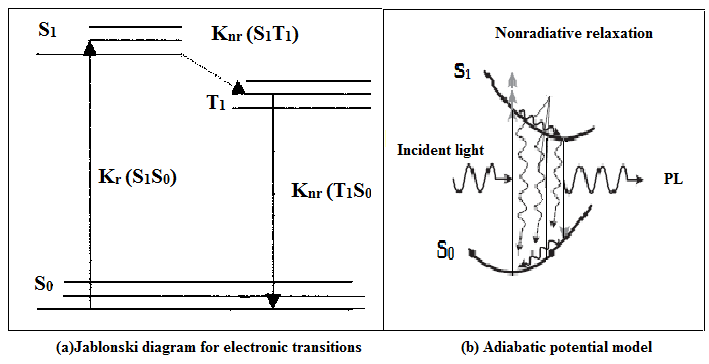
Fig. 4(a): Jablonski diagram for electronic transitions Fig. 4(b): Adiabatic potential model
Jablonski diagram illustrating possible electronic processes following absorption of a photon for Alq3 as shown in Fig.4(a), Kr and Knr indicate the radiative and non-radiative transitions and here only singlet to singlet (S1, S0) is radiative and remaining transitions are non-radiative. This electronic transition is supported by adiabatic potential model of dynamical relaxation process for electroluminescence in Alq3 reported by Akai et.al shown in Fig. 4(b) [19] S1 S0.
Fig. 5 exhibits PL excitation spectra of phosphor for different concentration of Fe3+ with Alq3.

Fig. 5: Photoluminescence Excitation spectrum: Fe3+ doped Alq3
Whereas, fig. 6 exhibits PL emission spectra of phosphors for different concentration of Fe3+ doped in Alq3 with various concentrations.
The prominent PL emission peak is observed at 427 nm in indigo region of spectrum for 438nm excitation wavelength for 1% concentration Fe3+ doped in Alq3 with higher intensity. The prominent PL emission peak is observed at 423 nm in violet region of spectrum for 438nm excitation wavelength for 2% concentration Fe3+ doped in Alq3. The prominent PL emission peak is observed at 427 nm in indigo region of spectrum for 416nm excitation wavelengthfor 5% concentration Fe3+ doped in Alq3 with lower intensity.
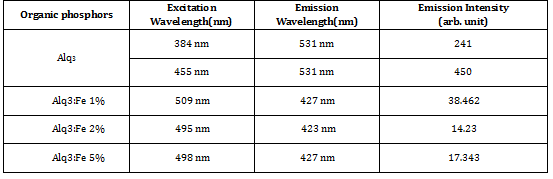
Different organic phosphors of Alq3 for different concentrations of Fe3+ have been synthesized. All phosphors prepared through co-precipitation route at room temperature, are α-phase out of four phases. Variations in the substituent on the quinoline rings affect its luminescence properties [20-22]. Fe3+ changes PL emission intensity of Alq3 phosphor. Among all prepared phosphors, AlQ3: Fe3+ (1%) attributes maximum PL intensity as compared to doped Alq3 for other concentrations of Fe3+. The excitation spectra are in the range of 423 nm to 427 nm. AlQ3:Fe3+ (1%) phosphor manifests indigo emission with highest intensity. Their values are summarized in table 2.
Table 2: Intensity comparisons: Alq3 , Fe3+ doped Alq3 with different concentrations
FTIR of Fe3+ doped Alq3 Figure 7. FT-IR is an analytical technique which confirms the molecular structures of the synthesized complexes. This technique measures the absorption of various infrared light wavelengths by the material of interest. In order to probe the structural transformation of Alq3:Fe IR spectrum of Alq3:Fe samples were measured on KBr pellets in a Perkin Elmer LR 64912C Fourier transform infrared (FT-IR) spectrometer with KBr beam splitters and a resolution of 20cm–1. The spectra were collected over the range 4000–400 cm-1 by averaging 500 scans at a maximum resolution of 20 cm-1 as shown in Fig 7. In case of the polycrystalline samples, scattering due to crystalline is responsible for the broad background with some asymmetric peaks. KBr reduces the quality of the spectrum below 420cm–1, and hence not recorded. The 8-HQ shows intense lines above 700 cm–1. Thus, it is clear that for Fe3+ doped Alq3 the region above 750 cm–1 is dominated by the hydroxyquinoline ligand vibrations, whereas below 600 cm–1 the central part around the Al-atom becomes more important. In the range of 4000-2000, the broad peak at 3698 reveals the presence of alcohols while 1606 reveals C=O group in the synthesized complex. The absorption bands in the finger print region (1500-1400 cm-1) are generally due to intra molecular phenomena, and are highly specific for each material. The peak at 1606 predicts aromatic ring stretching, revealing the presence of C=C group. Strong peak at 1383 predicts aromatic ring stretching and the presence of nitro compounds. The peak at 1327 reveals C-N Amines. The presence of C-O is revealed by the peak at 1115. The peaks between the range 1000 -400 reveals the bonding of phenyl group.
Two prominent peaks in the lower range at 750 and 645s are due to C-H alkaline bonding. These results confirm the completion of quinoline ring formation and presence of quinoline structure in the metal complex.
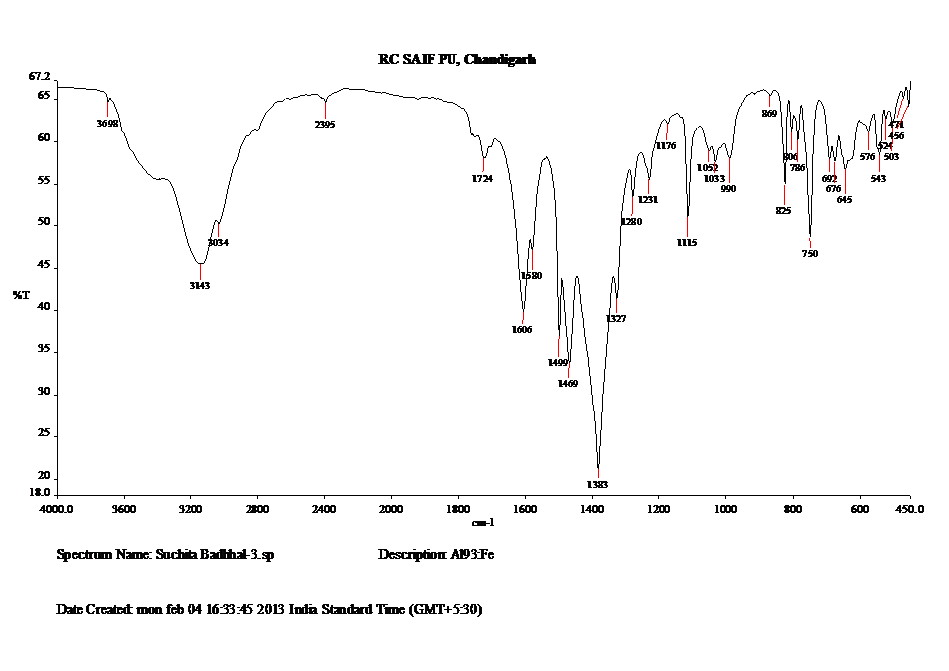
Fig.7: FTIR Spectrum: Fe3+ doped Alq3
UV /Vis spectroscopy of Fe3+ doped Alq3 In a standard UV-Vis spectrophotometer, a beam of light is split; one half of the beam (the sample beam) is directed through a transparent cell containing a solution of the compound being analyzed, and one half (the reference beam) is directed through an identical cell that does not contain the compound but contains the solvent. The wavelength of UV and visible light are substantially shorter than the wavelength of infrared radiation. The UV spectrum ranges from 100 to 400 nm and absorption of UV- visible light results in electronic transitions, electrons are promoted from low-energy ground state orbital to higher energy excited-state orbital. Compounds that contain nitrogen, sulfur, phosphorous, or one of the halogens all have unshared pair of electrons (n e-). If the structure contains no π-bonds, these n- electrons can undergo only n→σ* transitions. Because the n electrons are of higher energy than either σ or π electrons, less energy is required to promote an n electrons, and transitions occurat longer wavelengths than σ→σ* transitions. The longest wavelength absorption involves promoting one of the unshared electrons of nitrogen to an anti -bonding σ* orbital (n→σ*) with a λmax in relatively inaccessible region near 200 nm. The energies of the orbitals involved in electronic transitions have fixed values, and as energy is quantized, it would be expected that absorption peaks in ultraviolet/visible spectroscopy should be sharp peaks. However, this is rarely, if ever, actually observed. Instead, broad absorption peaks are seen. This is because a number of vibrational energy levels are available at each electronic energy level, and transitions can occur to and from the different vibrational levels, this result in peak broadening as shown in fig.8. of UV /Vis spectrum of Fe3+ doped Alq3. The situation is further complicated by the fact that different rotational energy levels are also available to absorbing materials only in a few cases, often in the vapor phase or in non-polar solvents, can fine structure be observed the Vibrational fine structure of the 210 nm to 270nm band and 350nm to 400nm band.

Fig.8: UV /Vis spectrum: Fe3+ doped Alq3
Absorption is observed in the range of 200 nm to 280nm and 320nm to 440nm causes objects to be in a UV region. When light is absorbed by a Fe doped Alq3 valence (outer) electrons are promoted from their normal (ground) states to higher energy (excited) states. In UV region from 210 nm to 270 nm some absorption due to π→π* and n→π* transition as per fig.2(b) (C=C, C=N). The absorption shifts towards longer wave length due to bonding between n-electron and π-electron (n→π*). The intensity of color compound increases due absorption shift towards longer wavelength (deepen color) & corresponding compound absorbed light in between 350 - 400 nm., and leaving the yellow and green light to be transmitted.
CONCLUSION From the characterizations, it concludes that all the synthesized phosphors i.e., Alq3, and Fe3+ doped with Alq3 prepared by low cost conventional co – precipitation method. X- Ray Diffractogram of Fe3+ doped Alq3 exhibits well defined X-ray diffraction lines for the powder sample that confirm its crystalline nature. The presence of distinct lines confirmed the polycrystalline nature of the synthesized complex. Average grain size of crystallites is found to be 80.90 nm. So, Sample can be inferred as nano material. The photoluminescence spectra comparison between Alq3 and Fe3+ doped complexes of Alq3 of different combinations is compared. The phosphorsprepared in laboratory at room temperature are α-phase, out of four phases. AlQ3: Fe3+ (1%) exhibits highest intensity in comparison other Fe3+doped Alq3 phosphors. Fe3+ + reduces PL emission intensity of Alq3 phosphor. The excitation spectra are in the range of 495 nm to 509 nm. The emission spectra observed in range of 423 to 427 nm for Fe3+ doped phosphors attribute indigo –violet emission. FTIR confirm the molecular structure and the completion of quinoline ring formation and presence of quinoline structure in the metal complex. Absorption is observed in the range of 200 nm to 280nm and 320nm to 440nm causes objects to be in a UV region. When light is absorbed by a Fe doped Alq3 valence (outer) electrons are promoted from their normal (ground) states to higher energy (excited) states. In UV region from 210 nm to 270 nm some absorption due to π→π* and n→π* transition as per fig (C=C, C=N). The absorption shifts towards longer wave length due to bonding between n-electron and π-electron (n→π*). The intensity of color compound increases due absorption shift towards longer wavelength (deepen color) & corresponding compound absorbed light in between 350 - 400 nm., and leaving the indigo-violet light to be transmitted. Thus, prepared phosphors can be a suitable candidate for indigo–violet emitting OLED, PLLCD and solid-state lighting applications.
REFERENCES
1. N.Thejo Kalyani, S.J. Dhoble and R.B. Pode. (2012). Renewable and Sustainable Energy. Reviews. 16:2696–2723.
2. B.W.D.D’Andrade, and S.R. Forrest. (2004). White organic light-emitting devices for solid-state lighting. Adv Mater. 16(18):1585–1595.
3. R.Schalf, B.A. Parkinson, P.A. Lee, K. W. Nebesny, G. Jabbour, et al. (1998). Photoemission spectroscopy of LiF coated Al and Pt electrodes. J Appl Phys. 84:6729.
4. Tang C, and VanSlyke S. (1987). Organic electroluminescent diodes. Appl Phys Lett. 51:913-915.
5. Berleb S, and Brutting W. (2002). Dispersive Electron Transport in tris(8-Hydroxyquinoline) Aluminum (Alq3) Probed by Impedance Spectroscopy. Phys Rev Lett. 89: 286601-286602.
6. Thejo Kalyani N, Dhoble SJ, Ahn JS, and Pode RB. (2010). Optical Properties of EuxRe ((TTA) 3Phen Organic Complexes in Different Solvents. J Korean Phys Soc. 57(4):746-751.
7. Knox JE, Halls MD, Hratchian HP, and Schlegel HB. Phys. (2006). Chemical failure modes of AlQ3-based OLEDs:AlQ3 hydrolysis. Chem Chem Phys. 8:1371- 1377.
8. Kraft A, Grimsdale AC, and Holmes AB. (1998). Electroluminescent Conjugated Polymers-Seeing Polymers in a New Light. Angew Chem Int Ed. 37(4):402-428.
9. Thejo Kalyani N, Dhoble SJ, Pode RB. (2011). Fabrication of red organic light emitting diodes (OLEDs) using EuxY (1-x) (TTA) 3Phen organic complexes for solid-state lighting. Adv Mater Lett. 2(1):65-70.
10. Grover R, Srivastava R, Rana O, Mehta DS, and Kamalasanan MN. (2011). New Organic Thin-Film Encapsulation for Organic Light Emitting Diodes. J. Encap. Adsorp. Sci. 2(1):23-28.
11. Ji W, Zhang L, Xu K, Xie W, Zhang H et al. (2011). Semitransparent white organic light emitting diodes with symmetrical electrode structure. Organic Electronics12(12):2192–2197.
12. M.Gratel. (2001). Photoelectrochemical cells. Nature. 414(6861):338-344.
13. Rai VK, Srivastava R, Kamalasanan MN. (2009). White organic light-emitting diodes based on blue fluorescent bis(2-(2 hydroxyphenyl)benzoxazolate)zinc [Zn(hpb)2] doped with DCM dye. Synth Met. 159:234-237.
14. S.A. Bhagat, S.B. Raut, and S.J. Dhoble. (2012). Study of photophysical properties of different metal complexes of Alq3. J. Bio. Chem. Lumin. 27(4) (wileyonlinelibrary.com) DOI 10.1002/bio.2431.
15. S.A. Bhagat, S.V. Borghate, Thejo Kalyani N, and S.J. Dhoble. (2014). Synthesis and characterization of pure and Li+ activated Alq3 complexes for green and blue organic light emitting diodes and display devices, Luminescence. J Bio Chem Lumin. 29(5):433-439.
16. S.A. Bhagat, S. V. Borghate, Thejo Kalyani N, and S.J.Dhoble. (2014). Novel Na+ doped Alq3 hybrid materials for organic light-emitting diode (OLED) devices and flat panel displays. J Bio Chem Lumin. 30(3):251-256.
17. S.A. Bhagat, S.V. Borghate, N.S. Koche, Thejo Kalyani N, and S.J. Dhoble. (2014). Study of photophysical properties AlBaq5. J Optik.125(15):433-439.
18. Hopkins TA, Meerholz K, Shaheen S, Anderson ML, Schmidt A, et al. (1996). Substituted Aluminum and Zinc Quinolates with Blue-Shifted Absorbance/Luminescence Bands: Synthesis and Spectroscopic, Photoluminescence, and Electroluminescence Characterization Chem. Mater. 8(2):344-351.
19. H Zeng, W Huang and J Shi. (2006). A covalently bonded AlQ3/SiO2 hybrid material with blue light emission by a conventional sol–gel approach. Chem Commun. 51(8):880-881.
20. V. A. Montes, R Pohl, J Shinar, and P Anzenbacher Jr. (2006). Effective Manipulation of the Electronic Effects and Its Influence on the Emission of 5-Substituted Tris(8-quinolinolate) Aluminum(III) Complexes. Chemistry - Euro J. 12(17):4523-4535.
21. S.A. Bhagat. (2020). Photoluminescence Properties of Mn2+ Doped ALQ3 Organic Phosphors for Oled Devices and Flat Panel Displays. Int J Nano Med Eng. 5(2):8-12.
22. S.A. Bhagat. (2021). Optical Properties of Potassium Doped Zinc (II) Bis (8-Hydroxyquinoline) Organic Nanophoshors. Int J Nano Med Eng. 6(2):219-224.